Results
These numbers come from model_assets/UncertaintyModel.ckpt, evaluated on the
held-out test set: 100,058 timestamps between 2023-08-01 00:00 and
2025-09-26 20:21 UTC.
Metrics
Group |
Samples |
RMSE (dex) |
MAE (dex) |
R² |
Pearson correlation |
68% coverage |
95% coverage |
|---|---|---|---|---|---|---|---|
Overall |
100,058 |
0.0933 |
0.0636 |
0.9687 |
0.9843 |
64.46% |
90.04% |
B |
13,589 |
0.0452 |
0.0379 |
0.6492 |
0.8934 |
59.58% |
95.59% |
C |
63,001 |
0.0801 |
0.0568 |
0.9279 |
0.9668 |
66.96% |
89.72% |
M |
22,386 |
0.1317 |
0.0932 |
0.7173 |
0.8734 |
62.01% |
89.08% |
X |
1,082 |
0.2181 |
0.1667 |
−0.1556 |
0.5969 |
30.87% |
58.69% |
Errors are computed on log10(flux), so they’re in dex. Coverage is the
fraction of measured values that land within 1 (68%) or 1.96 (95%) predicted
standard deviations, measured in the checkpoint’s normalized
log10(flux + 1e-8) space.
The model does well on B through M class, but X-class flux is its weak spot.Keep that in mind if you’re using FOXES during large events.
Full summaries:
Predicted Versus Measured Flux
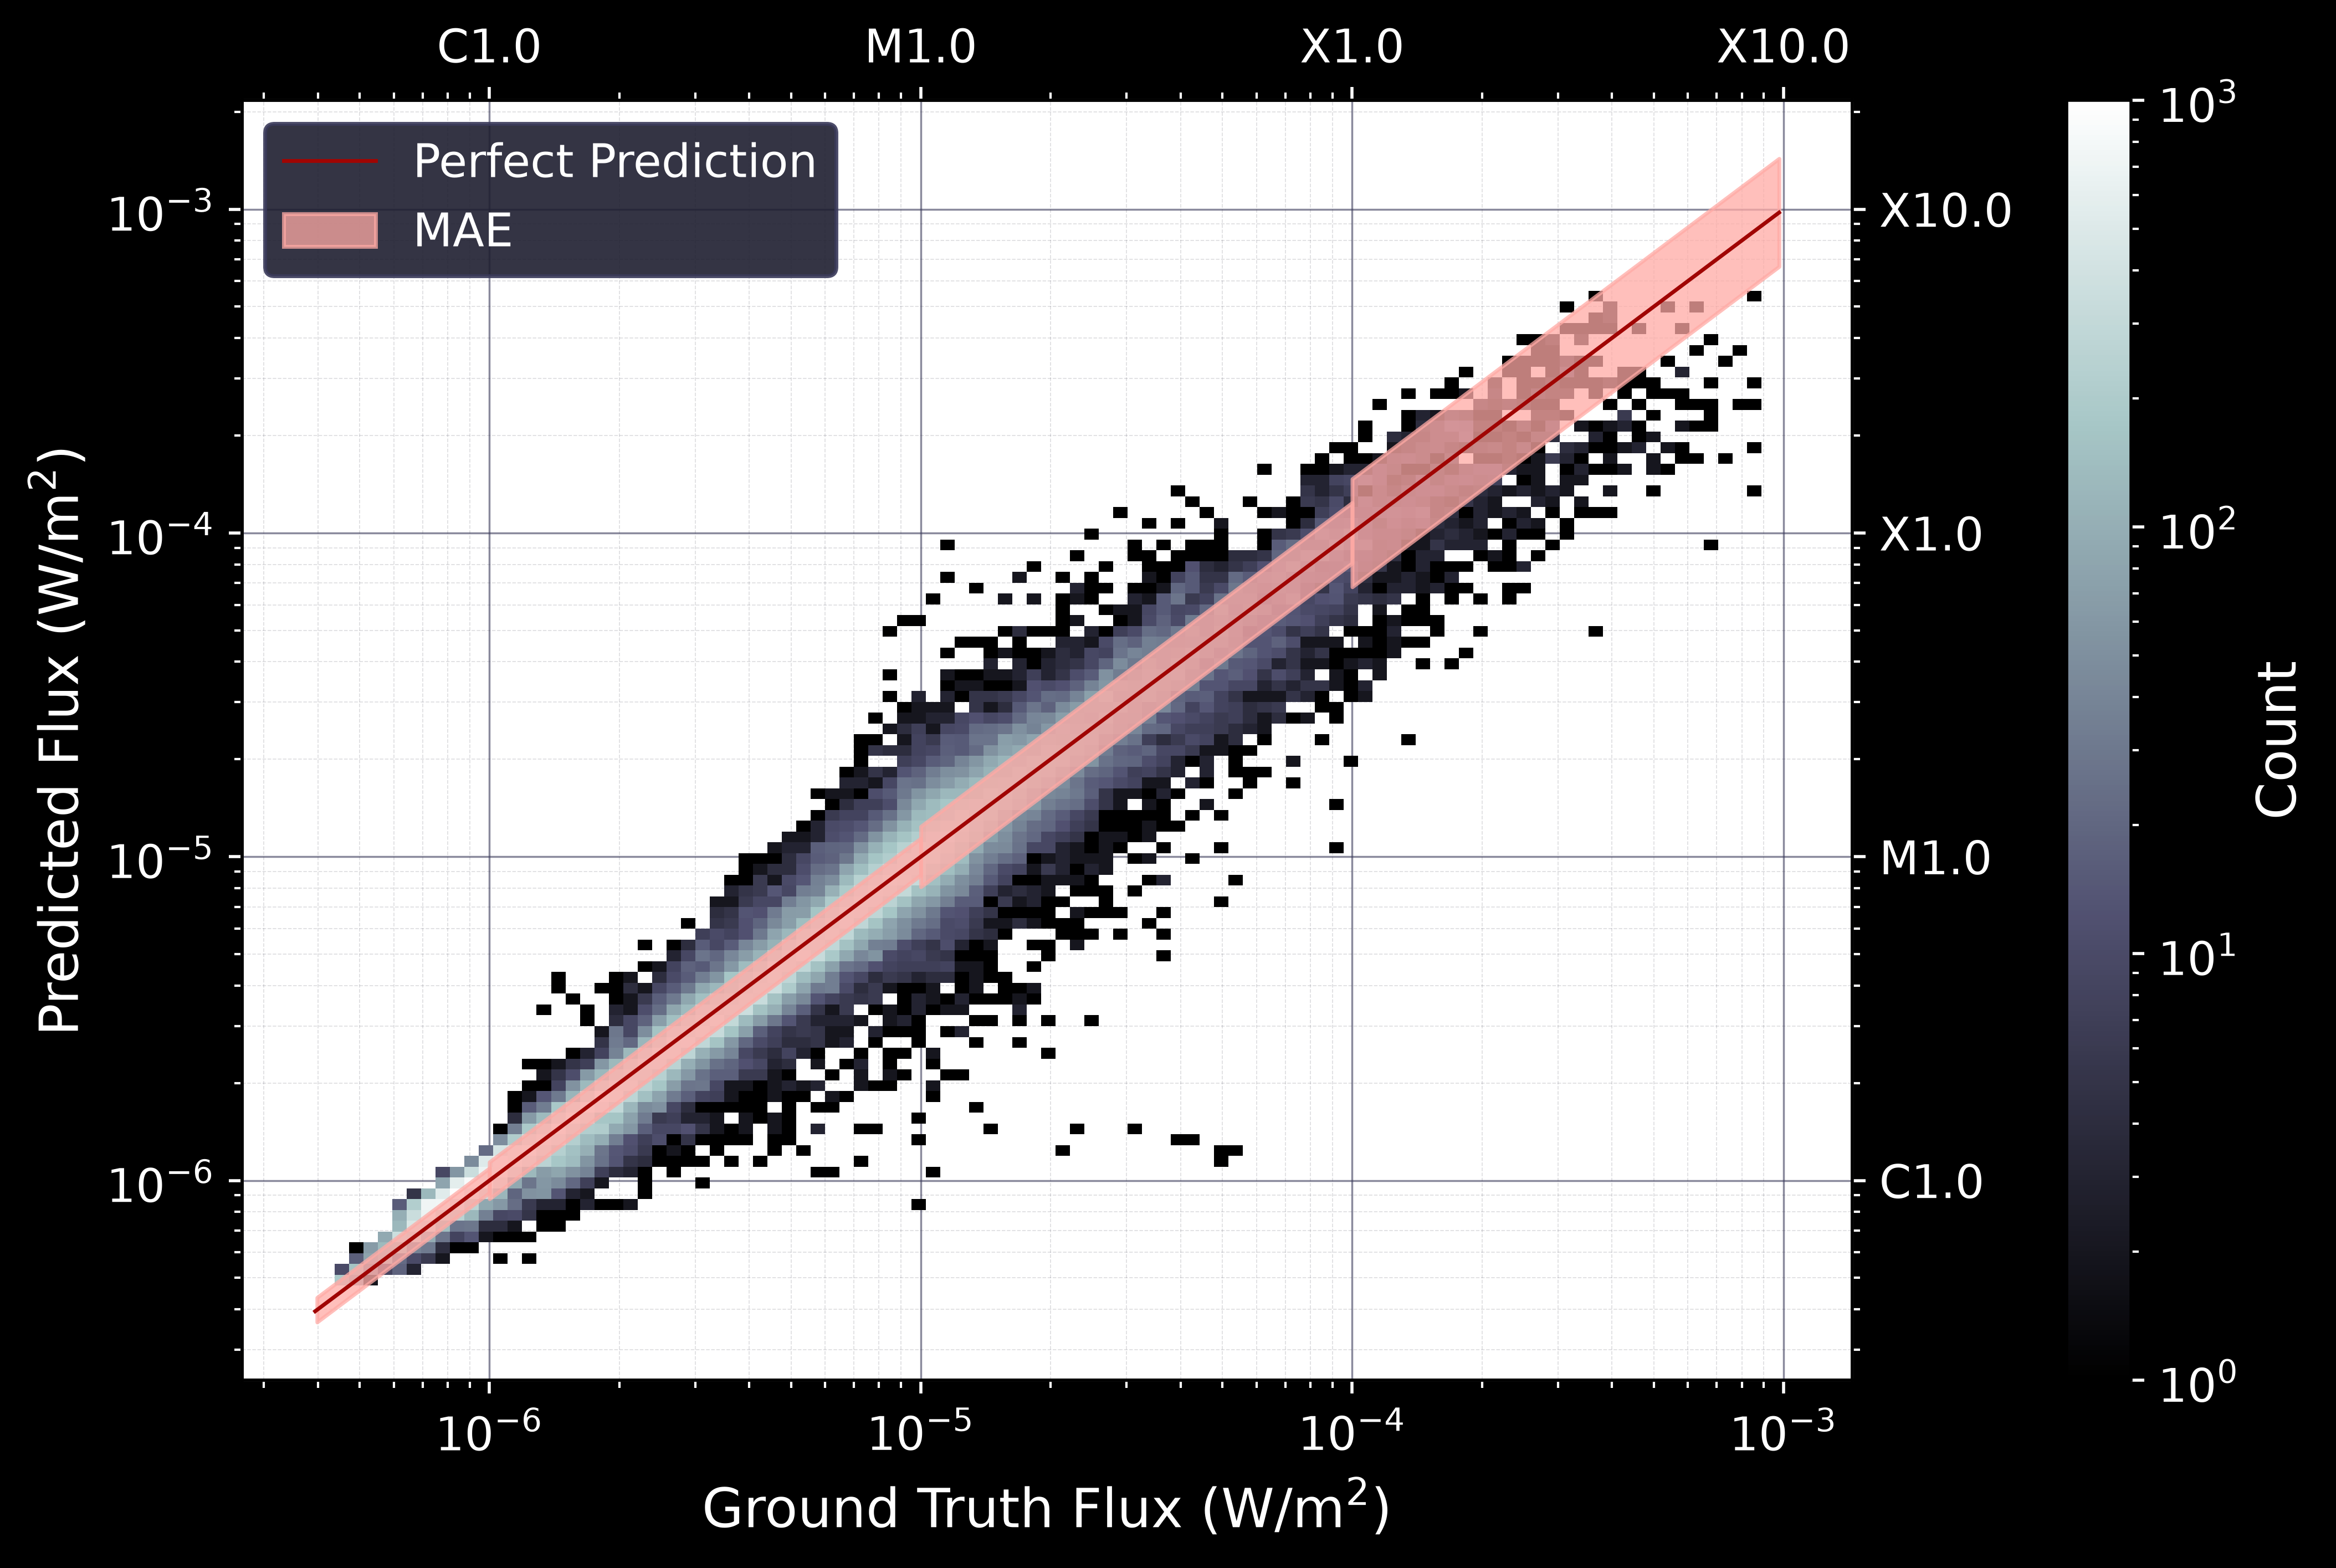
Full-disk flux in W/m². The red line is perfect agreement, and the shading shows the mean absolute error (in log space) for each flare class.
Calibration
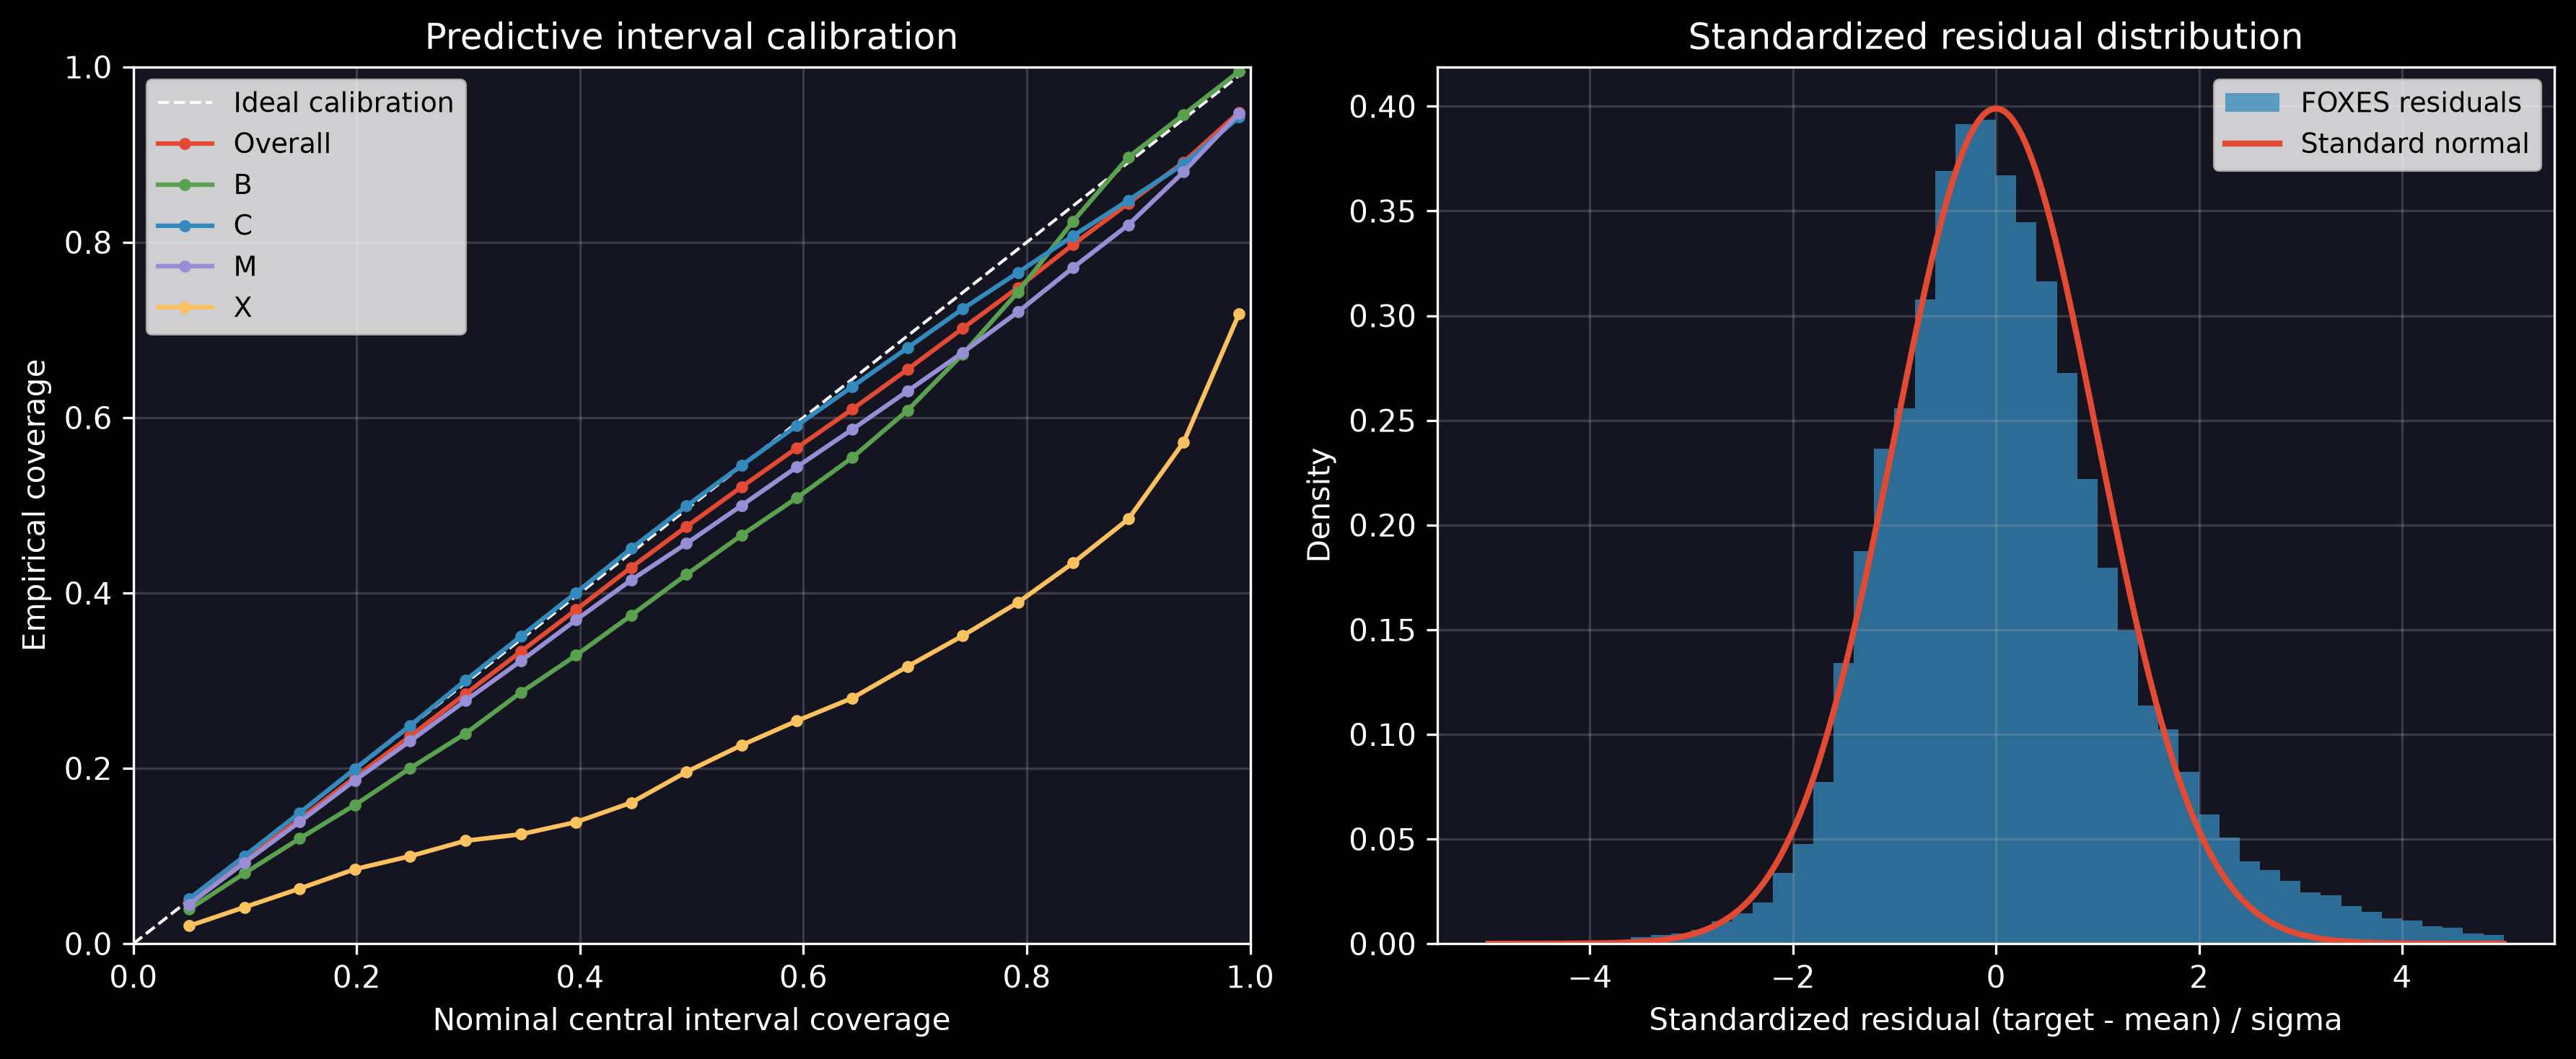
Left: how often the measured flux actually falls inside each nominal interval. Right: the distribution of standardized residuals.
To run the same evaluation on your own predictions, see the Evaluate Predictions workflow.